Chapter 3 Why RAP?
Reproducible Analytical Pipelines require a range of tools and techniques to implement that can be a challenge to overcome; so why bother learning to RAP?
- Does your team spend too much time moving data between various softwares?
- Could you reproduce your most recent publication’s stats? How about from five years ago?
- What would your team do with their time if it was freed up from copying and pasting?
- What proportion of spreadsheets contain errors?
3.1 The current statistics production process
Here we use the production of official statistics in Government; altough this process varies widely perhaps it looks something like this?
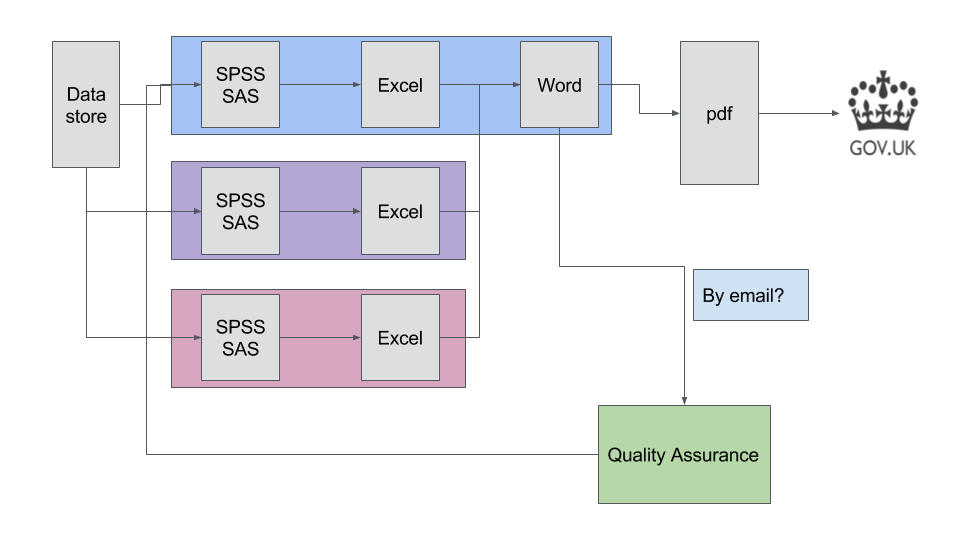
Broadly speaking, data are extracted from a datastore (whether it is a data lake, database, spreadsheet, or flat file), and are manipulated in proprietary statistical software, and possibly in proprietary spreadsheet software. Formatted tables are often then ‘copy and pasted’ into a word processor, before being converted to pdf format, and finally published to GOV.UK. This is quite a simplification, as statistical publications are usually produced by several people, so this process is likely to be happening in parallel many times.
Often quality assurance (QA) is a process takes place at the end of the process. At its simplest, this may be a word processor document or spreadhseet sent by email to colleagues for review, prior to being approved for publication.
3.1.1 The problem with this approach
Errors in spreadsheets are common due to human error3. There are plenty of spreadsheet horror stories to learn from and encourage us to try a different approach. We can mitigate these issues by minimising the role humans play in the tasks that they perform poorly4. This will free up human time to focus on complex tasks such as the interpretation of the statistics and communicating the implications of these findings to others.
Other issues are:
- Copy and pasting.
- Lack of proper version control.
- Testing and QA often happens at the end, not throughout.
A key element in this process is quality assurance. Each publication is meticulously checked to ensure the accuracy of the statistics being produced. This may take place throughout the production process or at the end prior to publication. Traditionally, QA has been a manual process which can take up a significant portion of the overall production time of a publication, as any changes will require the manual process of production to be repeated.
3.1.2 Desired Reproducible Analytical Pipeline
An analytical pipeline should have all the hallmarks of good scientific practice - it should be reproducible. We should make use of modern DataOps principles, tools and techniques to improve the quality of the final product in a more timely fashion compared to the traditional method.
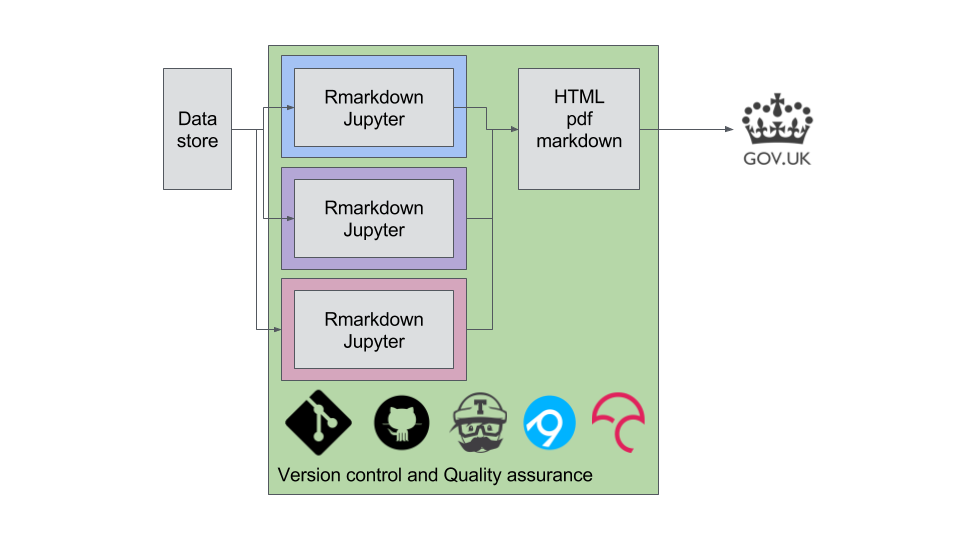
All these parallel work flows to produce different parts of the report (e.g. tables and figures represented by different colours) can be conducted by bespoke functions within an R software package (we are language agnostic but prefered R and Rmarkdown for our DCMS work due to their prior experience with R). Rather than copying and pasting between different software, we read our data in once using a tidy data set that we create. We then do all the analysis and report production within R and benefit from many open source tools that make up RAP. These are represented by the logos along the bottom; git, Github, Travis, Appveyor and codecov.
3.2 Why learning to RAP might be hard
Automating statistical report production is not without its challenges. RAP requires changes to your processes and is dependent on tools and techniques without which your journey may fail.
Based on ours and others’ experiences, here are some things that will make your road to RAP difficult (though not impossible):
- Data format changes unexpectedly: e.g. the source data are not stored in a relational database, but are provided from a third party in spreadsheets.
- Publication format changes frequently.
- Limited access to open source tools; ideally you would need access to the following:
- Rstudio
- R
- Rtools (required to build packages)
- git (command line or GUI - this is extremely important)
- github (need to be able to push and pull to/from a remote repository)
- Not coding in the open. Not coding in the open makes it much harder to collaborate, as you will not have free access to a range of automated tools like travis/appveyor/codecov/coveralls which are part of the RAP model.
- Business as usual (BAU): It’s not possible to do this kind of work whilst also doing BAU tasks. It takes time to get to grips with the techniques, and the first version should be considered a prototype that needs to be at least partly validated against a manual procedure.
Research on spreadsheet errors is substantial, compelling, and unanimous. It has three simple conclusions. The first is that spreadsheet errors are rare on a per-cell basis, but in large programs, at least one incorrect bottom-line value is very likely to be present. The second is that errors are extremely difficult to detect and correct. The third is that spreadsheet developers and corporations are highly overconfident in the accuracy of their spreadsheets.↩
Tasks that machines excel at↩