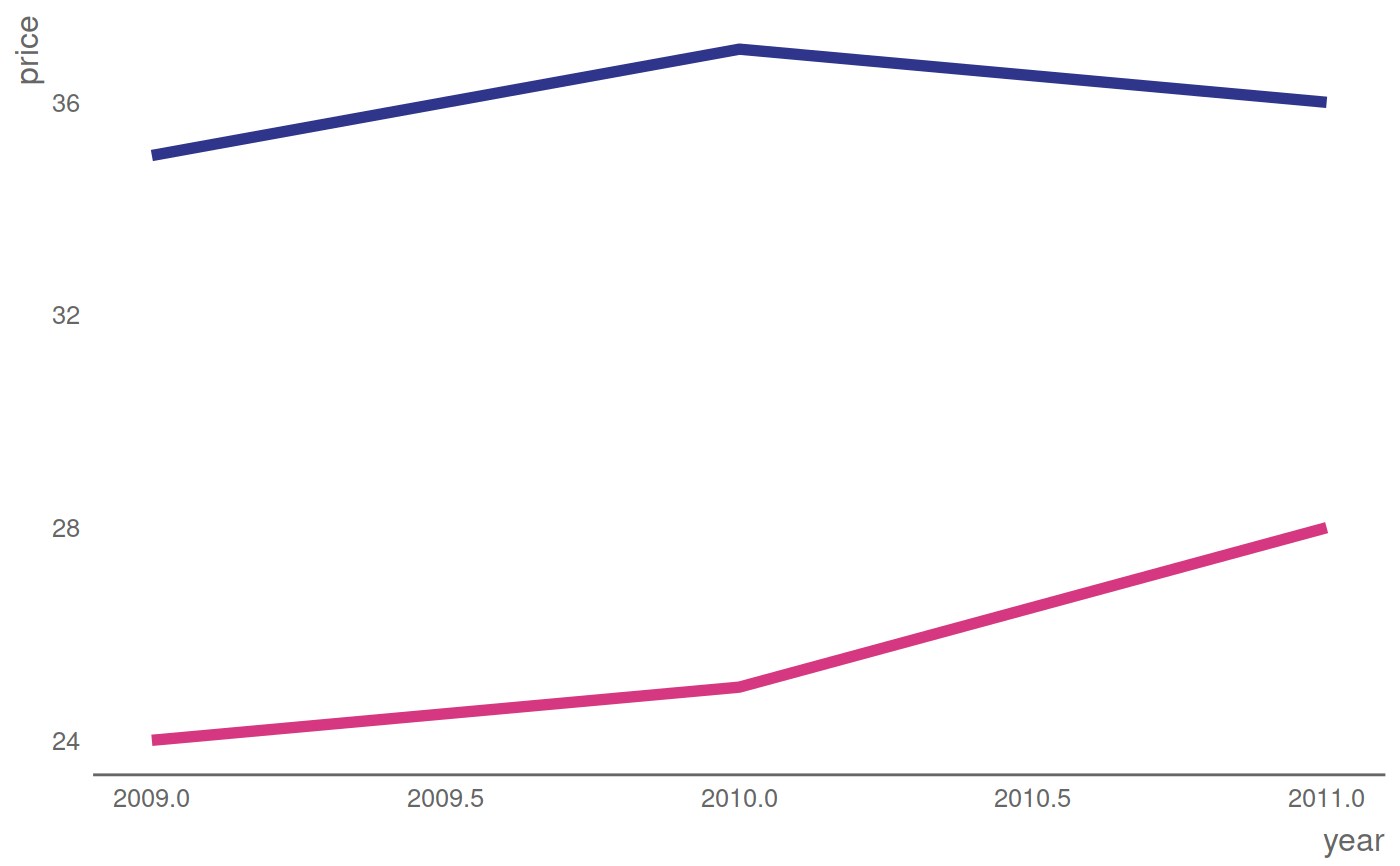
Discrete colour scales using the gov_cols palette
scale_gov.Rdscale_gov provides a means to easily use the
gov_cols palette in charts. It applies the palette in order as an
unnamed vector.
scale_gov(type = "fill", ...)
Arguments
| type | sets whether the scale applies to (line) |
|---|---|
| ... | additional arguments to be supplied to the underlying ggplot2
|
Value
Will not return anything of itself, but when used in conjuntion
with ggplot and (e.g.) geom_col from the
package ggplot2, will apply a colour scale to a plot.
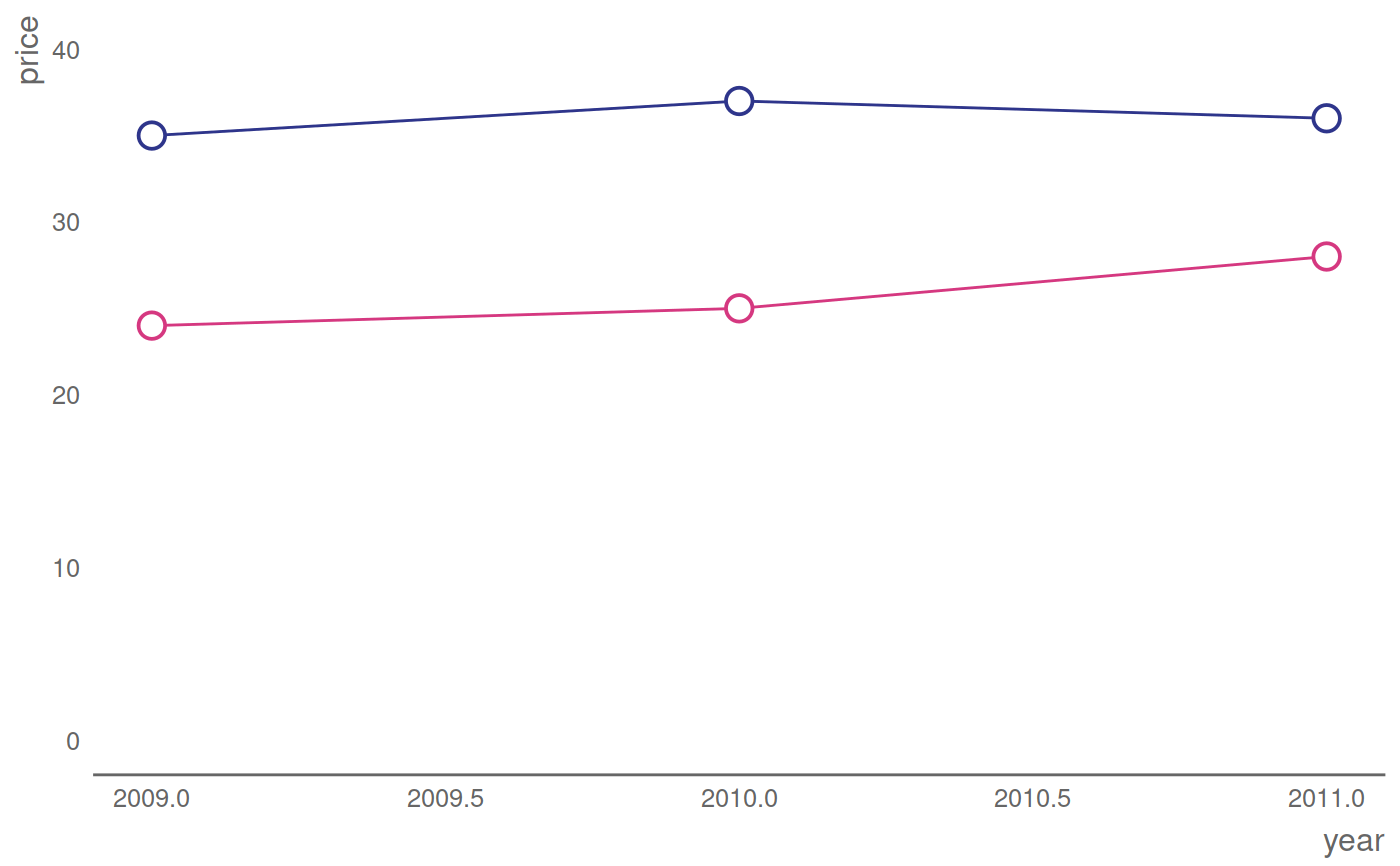
Examples
library(ggplot2) library(govstyle) library(dplyr) df <- data.frame( group = c("apple", "apple", "apple", "pear", "pear", "pear"), year = c(2009, 2010, 2011, 2009, 2010, 2011), price = c(35, 37, 36, 24, 25, 28)) # Column chart ggplot(df, aes(x = year, y = price, fill = group)) + geom_col(position = "dodge") + theme_gov() + scale_gov("fill")# Line chart ggplot(df, aes(x = year, y = price, colour = group)) + geom_line(size = 2) + theme_gov() + scale_gov("colour")# Point chart, with filled points (black outline) ggplot(df, aes(x = year, y = price, colour = group)) + geom_line() + geom_point(shape = 21, size = 4, stroke = 1, fill = "#ffffff") + theme_gov() + scale_gov("colour") + ylim(0,40)