theme_gov A government theme for ggplot2
theme_gov.Rdtheme_gov Provides a theme for ggplot2 to produce
government style visualisations in ggplot2.
theme_gov(base_size = 12, base_colour = "gray40", axes = "x")
Arguments
| base_size | Integer. Sets the base size of text for the plot.
Defaults to |
|---|---|
| base_colour | Character string. Sets the default colour of axes
and axis labels. Must be a named R colour or hexadecimal colour code
(e.g. "#FF0000"). Defaults to |
| axes | Character string. Specifies the presence or absence of axes
Must be one of |
Value
Will not return anything of itself, but when used in conjuntion
with ggplot and (e.g.) geom_point from the
package ggplot2, will apply styling to a plot.
Details
Builds on the 'grammar of graphics' framework implement in
ggplot2. Applying theme_gov() will adjust graphical parameters
to give a plot a feel more in line with gov.uk.
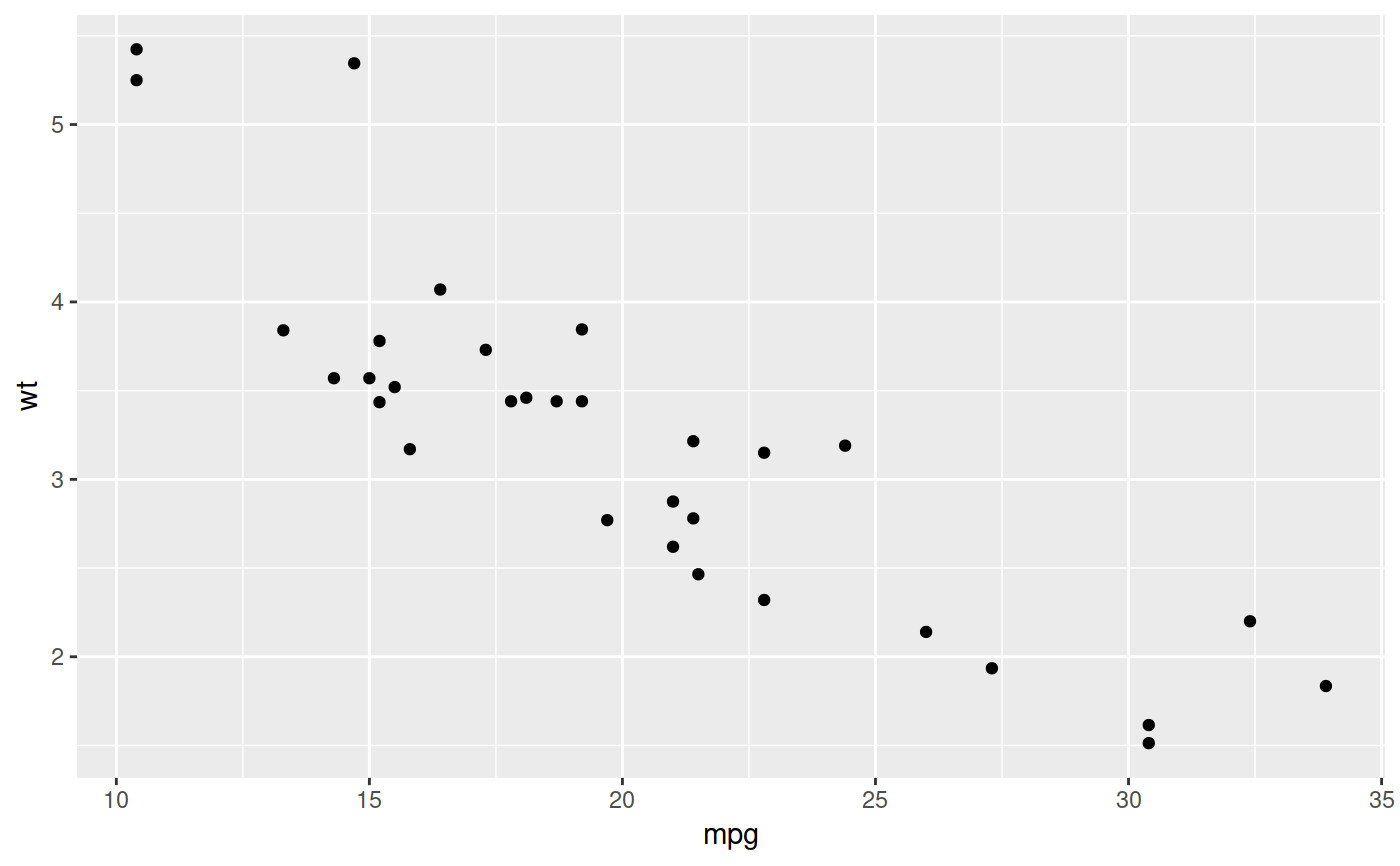
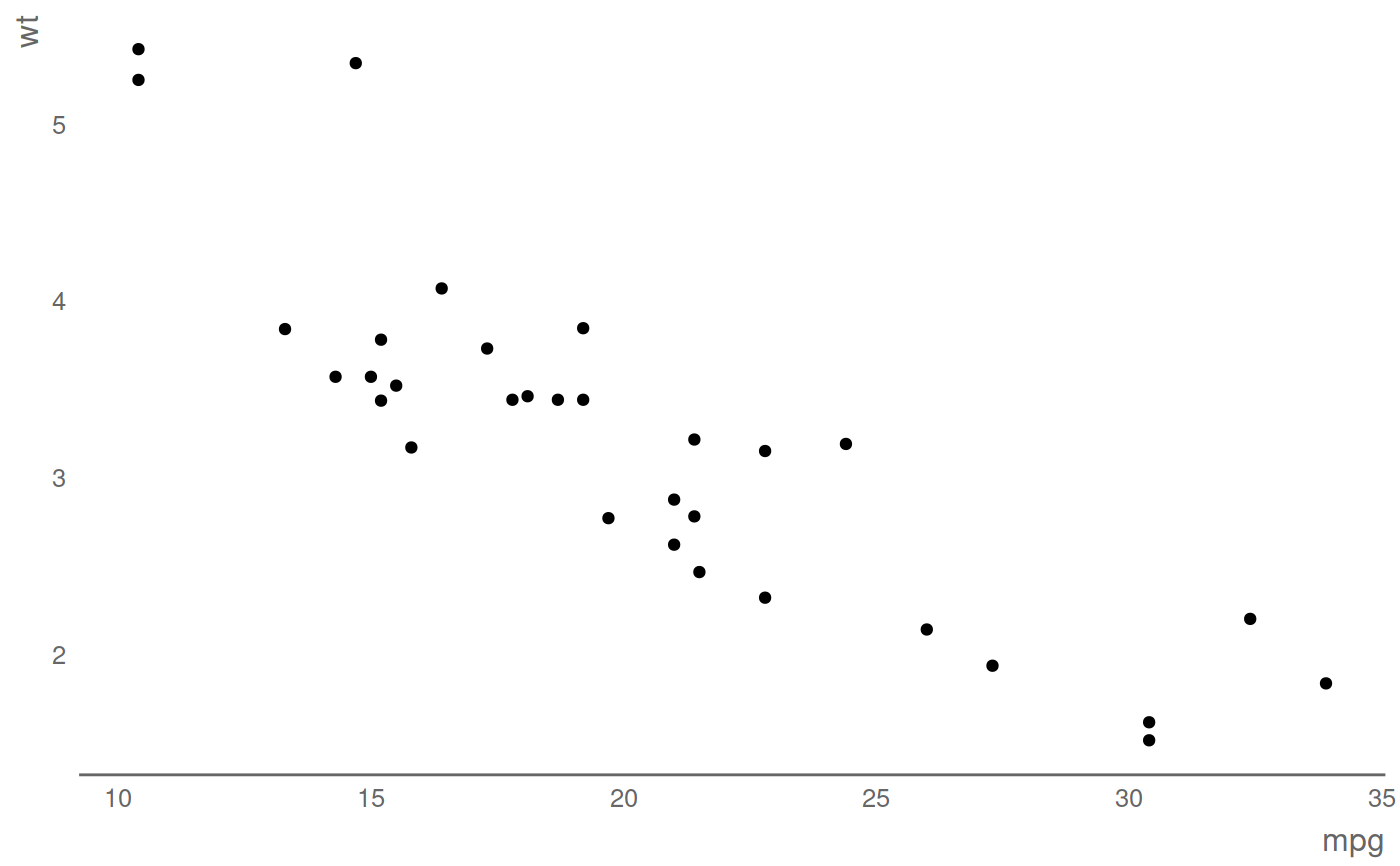
Examples
library(ggplot2) library(govstyle) library(dplyr) p <- mtcars %>% ggplot + aes( x = mpg, y = wt ) + geom_point() # Plot without any theme applied p# Now apply gov theme p + theme_gov()